

If you’ve ever stared at a stock chart wondering when to buy or sell, you’ve likely heard of the Relative Strength Index (RSI). It’s one of the most trusted and widely used tools in technical analysis—beloved by beginners and professional traders alike.
But how does the RSI indicator actually work, and how can it help you make smarter trading decisions? This article breaks down RSI in plain English, showing you how to interpret signals, avoid common traps, and use RSI with confidence in today’s fast-moving markets.
What Is the RSI Indicator?
The Relative Strength Index (RSI) is a momentum oscillator developed by J. Welles Wilder Jr. in 1978. It measures the speed and magnitude of recent price changes, showing whether a stock is potentially overbought (too high) or oversold (too low).

The RSI moves on a scale from 0 to 100:
- Above 70: The asset might be overbought — prices may soon cool off.
- Below 30: The asset might be oversold — a rebound could be coming.
- Around 50: Neutral — no clear trend.
This simple visual helps traders see at a glance if the market mood is overheated or exhausted.
How the RSI Indicator Works
The RSI measures the ratio of average gains to average losses over a specific period (commonly 14 days). It reflects momentum — how strong or weak recent price moves have been.
Here’s the basic idea:
- When a stock has more strong “up” days than “down” days, RSI climbs.
- When losses dominate, RSI falls.
- When RSI and price move in sync, the trend is confirmed. If they diverge, something might be changing.
For instance, if a stock’s price keeps rising but RSI starts falling, it may signal weakening momentum — a red flag for a potential correction.
RSI Formula (Simplified)
While most charting tools calculate RSI automatically, it’s helpful to know the logic behind it:

RSI = 100 - [100 / (1 + (Average Gain ÷ Average Loss))]
Traders usually use 14 periods (days, hours, or minutes depending on the chart). The higher the average gain relative to losses, the higher the RSI number.
You don’t need to do this math manually — platforms like TradingView, ThinkorSwim, or MetaTrader calculate it in real time.
How to Read RSI on Charts
Most trading platforms display the RSI as a line graph beneath the main price chart. It rises and falls as prices change.
Here’s how to read it:
| RSI Level | Market Condition | Possible Action |
|---|---|---|
| Above 70 | Overbought | Watch for a pullback or take profits |
| 50–70 | Bullish momentum | Look for continuation signals |
| 30–50 | Bearish momentum | Watch for weakness or short setups |
| Below 30 | Oversold | Look for rebound or buying opportunities |
👉 Pro Tip: RSI staying overbought or oversold for an extended period often means a strong trend, not necessarily a reversal. Context matters.

Also Read: How Did Tech Stocks React to the Recent Earnings Reports?
Why Traders Love RSI
RSI remains one of the most useful tools in technical trading because it:

- Identifies potential reversals before they happen.
- Confirms trend strength and direction.
- Filters false breakouts when combined with price action.
- Works across all markets — stocks, forex, crypto, and commodities.
It’s especially powerful when used with other indicators such as moving averages, MACD, or Bollinger Bands.
(Learn more about RSI from the Investopedia RSI Guide).
Adjusting RSI for Different Market Conditions
Markets don’t always behave the same way. During a strong uptrend, RSI often hovers between 40 and 80. During a downtrend, it tends to stay between 20 and 60.
To adapt:
- In bullish markets, consider raising the oversold threshold (e.g., from 30 to 40).
- In bearish markets, lower the overbought threshold (e.g., from 70 to 60).
This flexibility prevents you from misreading strong trends as reversal signals.

Also Read: What Small-Cap Stocks Could Explode This Year?
RSI Buy and Sell Signals

✅ Bullish (Buy) Signals
- RSI drops below 30 and then rises above it.
- RSI bounces off 40–50 during an uptrend (sign of strength).
- RSI forms a bullish divergence (price makes a lower low, RSI makes a higher low).
❌ Bearish (Sell) Signals
- RSI crosses below 70 after being overbought.
- RSI peaks around 50–60 in a downtrend.
- RSI forms a bearish divergence (price makes a higher high, RSI makes a lower high).
These signals aren’t guarantees but serve as probability-based clues. Combining RSI with trendlines, volume analysis, or support/resistance boosts accuracy.
What RSI Number Should You Use?

Understanding RSI Ranges
Different market phases have distinct RSI behaviors:
| Market Type | Typical RSI Range | Interpretation |
|---|---|---|
| Strong Uptrend | 40–80 | RSI rarely falls below 40 — trend is healthy |
| Strong Downtrend | 20–60 | RSI rarely exceeds 60 — momentum remains weak |
| Sideways Market | 30–70 | Range-bound oscillation — good for swing trades |
This helps traders tailor strategies. For example, swing traders look for bounces between 30–70, while trend traders focus on 40–80 patterns.
RSI Divergences: Early Warning Signals
Divergence occurs when price and RSI move in opposite directions — often signaling an upcoming reversal.
🔹 Bullish Divergence
- Price makes a lower low.
- RSI makes a higher low.
👉 Suggests weakening selling pressure and potential price rise.
🔸 Bearish Divergence
- Price makes a higher high.
- RSI makes a lower high.
👉 Indicates fading buying power and possible downturn.
Divergences are powerful but work best when confirmed by volume or trendline breaks.
Positive & Negative RSI Reversals
A lesser-known but highly effective RSI technique is reversals, discovered by Andrew Cardwell (a student of Wilder).
- Positive Reversal: RSI makes a lower low, but price makes a higher low → bullish signal.
- Negative Reversal: RSI makes a higher high, but price makes a lower high → bearish signal.
These reversals often appear mid-trend, signaling continuations rather than turnarounds — ideal for momentum traders.
RSI Swing Rejections (Advanced Signal)

Swing rejections show when momentum refuses to continue in the same direction, hinting at reversals.
Bullish Swing Rejection
- RSI drops below 30.
- RSI rises above 30.
- RSI dips again but stays above 30.
- RSI breaks its recent high.
➡️ This often signals a strong upcoming uptrend.
Bearish Swing Rejection
- RSI rises above 70.
- RSI drops below 70.
- RSI rises again but stays under 70.
- RSI breaks its recent low.
➡️ Indicates weakening momentum and a potential sell opportunity.
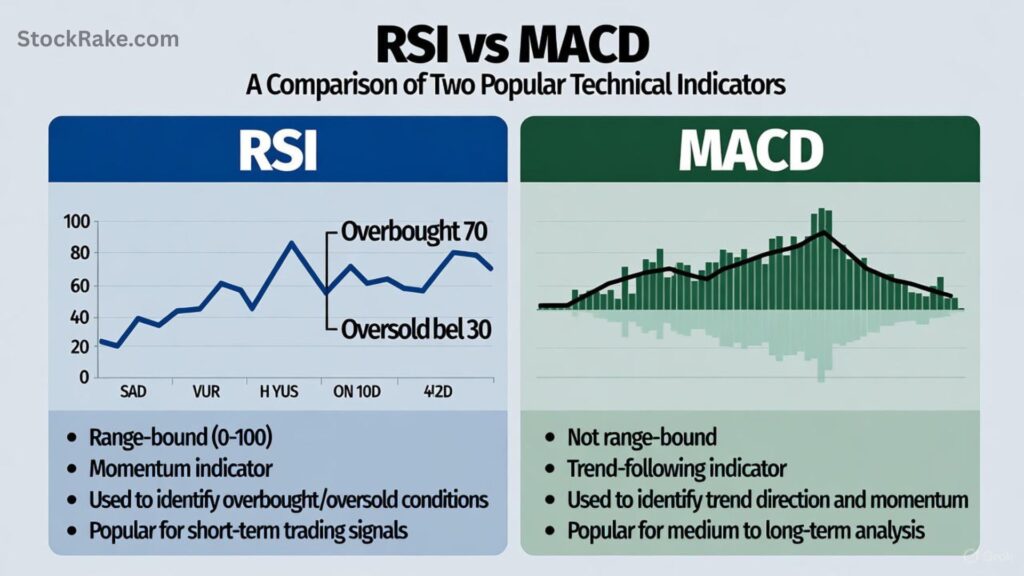
RSI vs. MACD: Which Is Better?
Both RSI and MACD (Moving Average Convergence Divergence) are momentum tools, but they measure different aspects:
| Feature | RSI | MACD |
|---|---|---|
| Focus | Speed & size of price changes | Relationship between moving averages |
| Best for | Overbought/oversold conditions | Trend direction & strength |
| Signal Type | Oscillator (0–100) | Crossover of lines |
| Ideal Use | Identify reversals | Confirm trend momentum |
Many professional traders use RSI and MACD together: RSI for entry timing, MACD for trend confirmation.
(For a deeper dive, check Forbes’ Guide on Momentum Indicators).
Also Read: How Do You Buy Your First Stock Step-by-Step
Limitations of RSI
While RSI is powerful, it’s not foolproof.
- False signals: During strong trends, RSI can stay overbought/oversold for weeks.
- Lagging indicator: It reacts to past prices, not future moves.
- Context matters: RSI works best in sideways or range-bound markets.
👉 Always pair RSI with price structure, support/resistance, or volume for confirmation.
What RSI Period Should You Use?
The default setting is 14 periods — suitable for most swing and position traders.
But you can tweak it:
- 5–9 period RSI: Quicker signals for day traders or scalpers.
- 14 period RSI: Balanced — ideal for swing trading.
- 21–30 period RSI: Smoother signals for long-term investors.
Shorter periods give faster reactions but can produce more false signals.
Good RSI Levels: Quick Reference
| RSI Value | Market Signal | Possible Action |
|---|---|---|
| Below 30 | Oversold | Watch for buying opportunities |
| 30–50 | Weak momentum | Wait for confirmation |
| 50–70 | Bullish zone | Consider adding to long positions |
| Above 70 | Overbought | Consider profit-taking or short setups |
RSI around 50 typically indicates a neutral zone, suggesting traders should wait before acting.
Real-World Example: RSI in Action
Imagine a tech stock that rallies from $100 to $120 over two weeks. The RSI climbs to 78, signaling overbought territory.
Within days, the stock dips to $112 — a healthy correction. RSI cools to 55, then rebounds as the price resumes upward. Traders who waited for RSI to pull back before re-entering caught the continuation safely.
Conversely, if RSI had diverged (falling while price rose), it would’ve hinted at weakening momentum — a warning to tighten stops or take profits.
Best Practices When Using RSI
- Combine indicators. Pair RSI with volume, trendlines, or moving averages.
- Use multiple timeframes. Check RSI on daily and weekly charts for stronger confirmation.
- Watch for divergences and reversals. They often precede major turns.
- Avoid acting on RSI alone. Always consider fundamentals and broader market sentiment.
- Backtest your strategy. Use historical charts to see how RSI signals would have played out.
Conclusion
The RSI indicator is one of the simplest yet most powerful tools in stock trading. By measuring market momentum, it helps traders identify overbought or oversold conditions, confirm trends, and spot reversals early.
However, no indicator works in isolation. The best traders use RSI as part of a complete strategy — blending technical signals, risk management, and solid market understanding.
Whether you’re day trading, swing trading, or investing long-term, mastering RSI can dramatically improve your timing and confidence.
FAQs About RSI Indicator
Q1. What does an RSI above 70 mean?
It indicates the stock might be overbought — prices may pause or pull back soon.
Q2. What is the best RSI setting for day trading?
A 5–9 period RSI offers faster reactions, but it’s more volatile. Many day traders prefer RSI(9).
Q3. Can RSI be used in crypto trading?
Absolutely! RSI works across all markets, including crypto, forex, and commodities.
Q4. What’s a bullish divergence in RSI?
When price makes a lower low but RSI makes a higher low — a possible signal of reversal to the upside.
Q5. Should I buy when RSI is below 30?
Not automatically. Wait for confirmation (e.g., RSI rising back above 30 or strong support levels).