One of the main goals of any market analyst is to figure out what the market is doing. Is it going up or down? Is it trending or just moving sideways? A lot of people start by looking at moving averages to answer these questions.
A common rule of thumb is this: if the market is trading above its 200-day moving average, it’s in a bull market. If it’s below that line, it’s considered a bear market.
Why Moving Averages Matter
Moving averages are popular tools in technical analysis. They help smooth out price movements and filter out short-term noise, making it easier to see the overall trend. Traders often use them to identify trends and to act as flexible support or resistance levels.
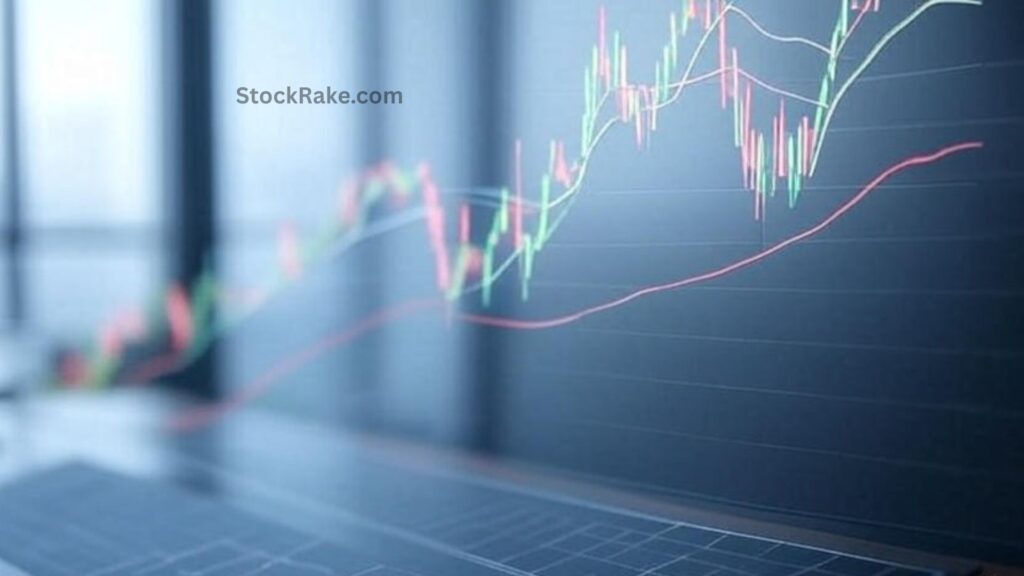
Many also build trading strategies around moving averages. For example, they might look for a shorter-term average crossing over a longer one as a signal to buy or sell.
Understanding Moving Averages in Simple Terms
What Is a Moving Average?
A moving average shows the average price of an asset over a certain number of days. It moves with time because it keeps updating with the latest data. It helps traders figure out if the market is trending and where possible support or resistance levels might be.

Also Read: How to Automate Your Finances for Long-Term Wealth
Traders also watch for “crossovers”—when one moving average crosses another—as signs of a potential change in trend.
Common Types of Moving Averages
- Simple Moving Average (SMA)
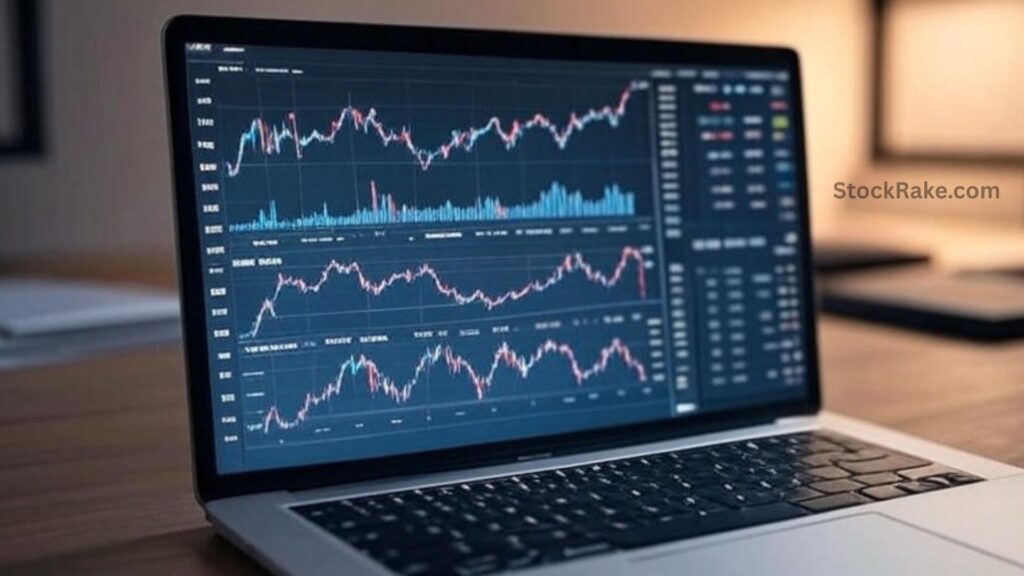
This is the average of the closing prices over a set number of days. For example, a 10-day SMA adds up the closing prices of the last 10 days and divides by 10. Each day, the oldest number drops off, and a new one gets added. All data points are treated equally. - Exponential Moving Average (EMA)
This one gives more weight to recent prices, so it reacts faster to changes. It’s useful for spotting momentum but may also give more false signals during choppy markets. - Weighted Moving Average (WMA)
Like the EMA, the WMA focuses more on recent prices. But instead of using exponential math, it adds weight in a straight line—so yesterday counts more than the day before, and so on. - Smoothed Moving Average (SMMA)
This one smooths out prices even more by including older data. It’s slower to react but helps remove more noise from the market.
How Traders Use Moving Averages
Spotting Trends
Moving averages are great for seeing where the market is heading. If the average is going up and prices stay above it, it usually means the market is in an uptrend. If the average is falling, it suggests a downtrend. If it’s flat, the market might be in a sideways phase or consolidating.
Acting as Support and Resistance
In uptrends, moving averages can act like a “floor” where prices tend to bounce up. In downtrends, they can act like a “ceiling” that holds prices down. These levels work partly because many traders expect them to, creating a kind of self-fulfilling prophecy.

Also Read: What’s the Right Asset Allocation by Age?
The effect also depends on the time frame. A 20-day moving average might cause quick bounces, while a 200-day average could hold prices longer and signal bigger trend shifts.
Popular Moving Average Strategies
1. Price Crossovers
When the price crosses above a moving average, it can be a signal to buy (bullish). If it falls below, it might be time to sell (bearish). For example, if a stock climbs above its 20-day EMA after a pullback, it may signal the trend is continuing upward.
Many traders also use these crossovers as filters. For instance, they may avoid shorting a stock that’s climbing above a rising 20-day average.
2. Moving Average Crossovers
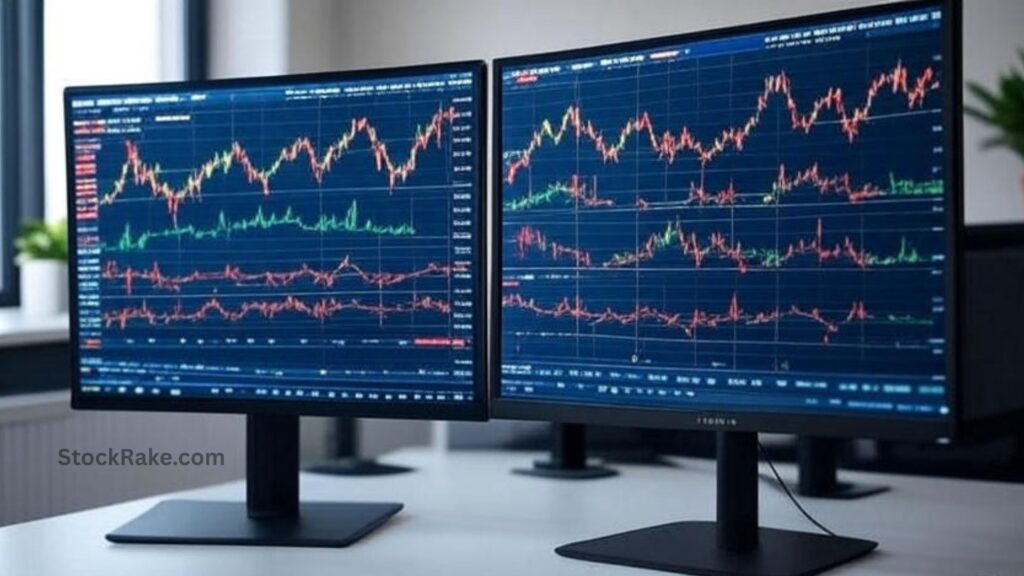
This strategy uses two moving averages. When the short-term average (like the 50-day) crosses above the long-term one (like the 200-day), it’s called a golden cross and may signal a new uptrend. The opposite, when the 50-day falls below the 200-day, is called a death cross and often signals a downtrend.
While this method works well for trend-following, it can also give false signals, especially in choppy markets. To stay profitable, traders manage risk by limiting how much they risk per trade—usually 1% to 2%—and aiming for bigger wins than losses.
Pros and Cons of Moving Averages
Pros:
- Helps spot market trends
- Acts as dynamic support/resistance
- Reduces short-term noise
- Can generate buy/sell signals
- Works across timeframes and markets
- Pairs well with other indicators

Also Read: Should You Follow Warren Buffett’s Portfolio Moves?
Cons:
- It’s a lagging indicator (reacts after the fact)
- Doesn’t work well in sideways/choppy markets
- Can produce false signals
- Doesn’t predict future price movements
Boosting Your Strategy with Other Tools
To improve accuracy, traders often combine moving averages with other indicators. For example:
- MACD (Moving Average Convergence Divergence) helps confirm momentum changes.
- RSI (Relative Strength Index) shows overbought or oversold conditions.
- Bollinger Bands help spot breakouts in sideways markets.
- ATR (Average True Range) adjusts moving average settings based on market volatility.
Final Thoughts
Moving averages are simple but powerful tools. They help traders cut through the noise and see the bigger picture. Whether you’re just watching price direction or building a full trading system, knowing how to use moving averages can give you a real edge in the markets.
Let me know if you want this turned into a cheat sheet or visual guide too!
